Where have we left?
If you followed along with my last story, you now should have a Raspberry Pi Pico W that can measure temperature, humidity, and an approximation of the carbon dioxide concentration.
Uploading data
For uploading the sensor readings, we will use MQTT. MQTT (Message Queueing Telemetry Transport) is a lightweight, publish-subscribe, machine-to-machine network protocol. It is the perfect match for small IoT use cases like this one.
For now, we will upload the readings to Adafruit IO. It is a great platform if you want to quickly deploy a small prototype or a proof of concept. They offer a free plan and a paid plan. The free one only comes with limited resources:
-
30 data points per minute
-
30 days of data storage
-
Actions (like alerts or scheduled events) every 15 minutes
-
5 dashboards
-
5 groups
-
10 feeds
A free account will be just enough as this project will neither exceed the free 30 data points per minute nor the ten feeds. Here you can learn more about Adafruit IO.
Alternatively, you can probably use any other service that supports MQTT without having to change the code that much.
Setting up Adafruit IO
Create an Adafruit Account. Then set up your feeds. Start by making a group and call it air-quality (of course you can give it any other name, but remember to adapt your code accordingly). Then add the feeds. You will need one for each sensor reading. So now add those feeds to your group:
-
co2
-
tvoc
-
humidity
-
temperature
The code
First of all, you will have to create a config file containing your WiFi and Adafruit IO credentials. We will use this file to connect to Adafruit IO via your WiFi. Create a file called `settings.toml` and insert all your credentials:
WIFI_SSID = "your-wifi-ssid"
WIFI_PASSWORD = "your-wifi-password"
AIO_USERNAME = "your-username"
AIO_KEY = "your-username-key"
BROKER = "io.adafruit.com"
PORT = 1883
The next step is to import a few more dependencies. Start with installing the MQTT module by copying the corresponding folder (`adafruit_minimqtt`) into the Pico’s lib folder. (Have another look at part 1 if you don’t remember how to do this.)
Now you can add the code. Here’s the new `code.py`:
import os
import time
import ssl
import socketpool
import wifi
import adafruit_minimqtt.adafruit_minimqtt as MQTT

import board
import busio

import adafruit_ccs811
import adafruit_dht


# WiFi setup
wifi.radio.connect(os.getenv("WIFI_SSID"), os.getenv("WIFI_PASSWORD"))

# Feed setup
co2_feed = os.getenv("AIO_USERNAME") + "/feeds/air-quality.co2"
tvoc_feed = os.getenv("AIO_USERNAME") + "/feeds/air-quality.tvoc"
temperature_feed = os.getenv("AIO_USERNAME") + "/feeds/air-quality.temperature"
humidity_feed = os.getenv("AIO_USERNAME") + "/feeds/air-quality.humidity"

pool = socketpool.SocketPool(wifi.radio)

# MQTT setup
def connected(client, userdata, flags, rc):
    # gets called when client is connected successfully to the broker
    print("Connected to Adafruit IO")


def disconnected(client, userdata, rc):
    # gets called when client is disconnected
    print("Disconnected from Adafruit IO")

mqtt_client = MQTT.MQTT(
    broker=os.getenv("BROKER"),
    port=os.getenv("PORT"),
    username=os.getenv("AIO_USERNAME"),
    password=os.getenv("AIO_KEY"),
    socket_pool=pool,
    ssl_context=ssl.create_default_context(),
)

mqtt_client.on_connect = connected
mqtt_client.on_disconnect = disconnected

print("Connecting to Adafruit IO...")
mqtt_client.connect()

# DHT setup
dht = adafruit_dht.DHT22(board.GP2)

# I2C setup
i2c = busio.I2C(scl=board.GP1, sda=board.GP0)
ccs811 = adafruit_ccs811.CCS811(i2c)

# Wait for the sensor to be ready
while not ccs811.data_ready:
    pass


def average(measurements, key):
    sum = 0
    for i in measurements:
        sum = sum + i[key]
    return sum / len(measurements)


measurements = []
while True:
    try:
        print()
        print(len(measurements))
        print("CO2: {} PPM\tTVOC: {} PPM".format(ccs811.eco2, ccs811.tvoc))
        print("Temp: {:.1f} *C\tHumidity: {}%".format(dht.temperature, dht.humidity))

        if len(measurements) >= 60:
            print("Sending data to Adafruit IO")

            mqtt_client.publish(co2_feed, average(measurements, "co2"))
            mqtt_client.publish(tvoc_feed, average(measurements, "tvoc"))
            mqtt_client.publish(temperature_feed, average(measurements, "temperature"))
            mqtt_client.publish(humidity_feed, average(measurements, "humidity"))

            measurements = []
        else:
            measurements.append(
                {
                    "co2": ccs811.eco2,
                    "tvoc": ccs811.tvoc,
                    "temperature": dht.temperature,
                    "humidity": dht.humidity,
                }
            )

    except RuntimeError as e:
        print("Reading error: ", e.args)

    time.sleep(1)
Let’s break it down, as there are quite a few new lines:
The first thing you will notice is that we added some more imports for establishing a WiFi connection and using MQTT.
We then immediately use the imported libraries and the credentials from the settings file to set up WiFi and the Adafruit IO feeds. That’s where you would have to make changes if you named your feeds differently.
We then establish our MQTT connection.
Next comes the sensor setup. This all stays the same.
Last but not least comes the main loop. Until now, we measured every second. We won’t be able to send four data points to Adafruit IO every second as they only give us 30 per minute. So instead we will only upload data every 60 seconds. To prevent weird spikes in our feeds we will still measure every second, but then upload the average values.
Visualizing the data
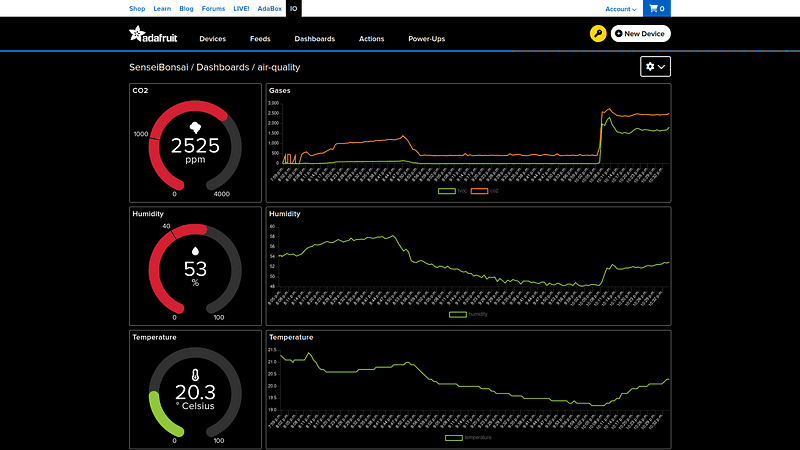
Now that your Pico should be able to read from the sensors and upload the data, we need a way to visualize it. You can take a look at any feed on Adafruit IO and inspect all the data points. There is already a simple graph, too.
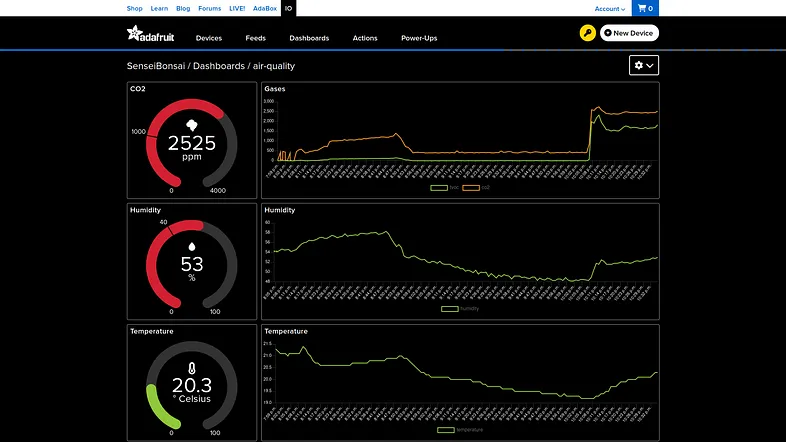
You can also create a dashboard combining those feeds. Adafruit has a lovely drag-and-drop dashboard builder for that:
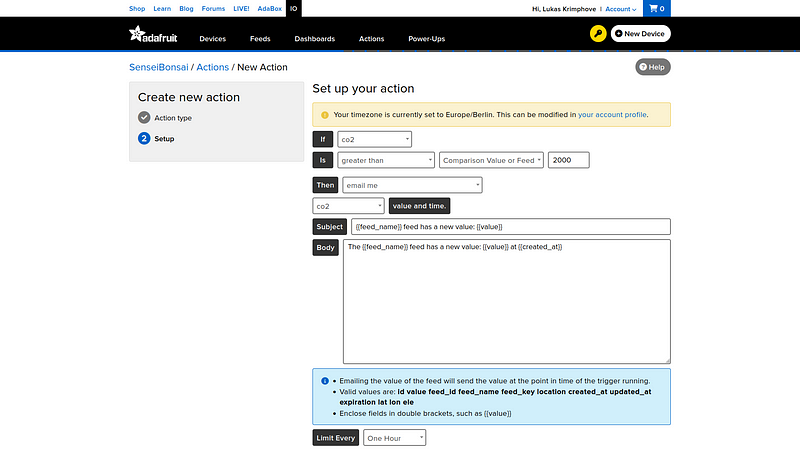
You can even use Adafruit IO to create alerts using Actions. If you want to you can create a reactive action that alerts you whenever the co2 value gets too high:
What’s next?
There are a few ways to go from here:
-
get into 3D modeling and build a nice case using a 3D printer
-
add a small screen to the Pico, so that we don’t need a web browser to have a look at the data
-
send data to a home server instead, so that we aren’t limited by Adafruit IO
If you are interested in what comes next, stay tuned.